spice rap, rap splice
This is a blog post version of a presentation I gave during the first meetup of the Montpellier chapter of R Ladies. The meetup was quite a success and planted the seed for a great local R community.
Now we are more R-ladies! Oh yeah! 🎉💪💜🎈🤗 #RLadiesMontpellier #firstMeetup! pic.twitter.com/3pFoofBdNd
— R-Ladies Montpellier (@RLadiesMontpel) December 12, 2018
Criscely started the meetup by a very complete presentation of the values and importance of the global R Ladies organization, and the desire to create this local community in Montpellier, Cécile then walked us through many packages and functions of the tidyverse with a movie dataset, i.e. comparing movies from Disney, Marvel and DC comics. Turns out, The Lion King was a great success and Superman Returns did not do well …
I was invited to close the meetup with a talk about …

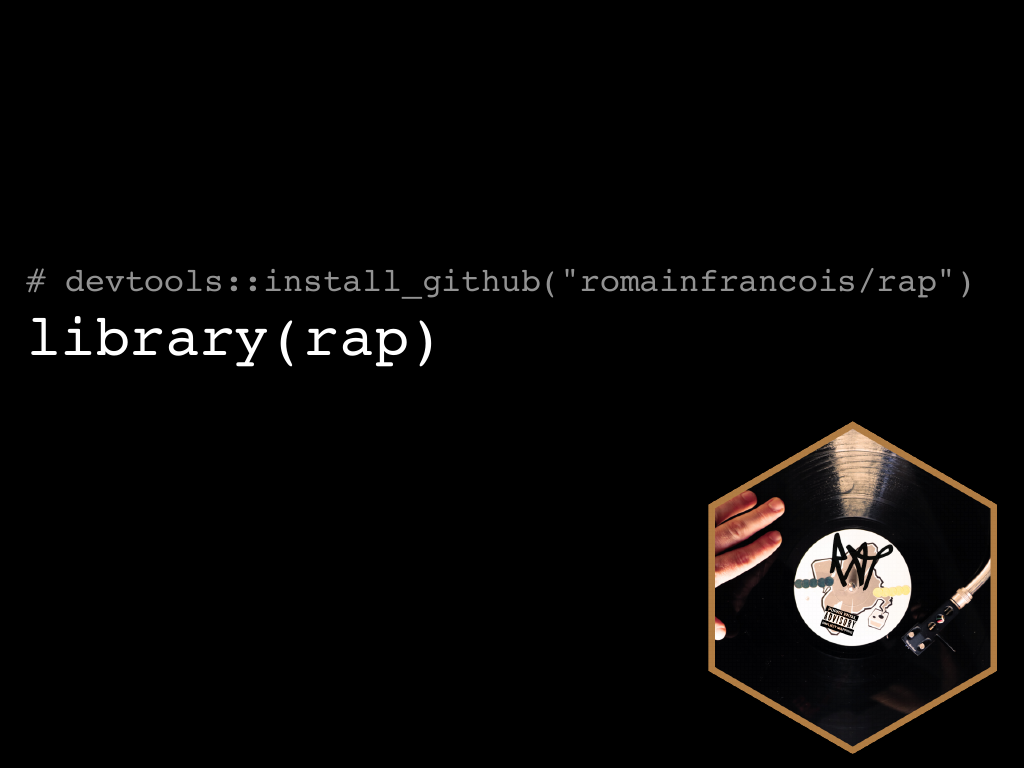
rap is a small experimental package for iterating on rows of
a data frame. The name stands for rowwise map to hint
at a legacy of both dplyr::rowwise() and purrr::map. It went
through a few different names before settling with rap:
zip, to echo thezipoperator in python, but then it was too close to zip files andutils::zip().zapwas close enough tozipbut ended likemap, but thenrlang::zap()ruled it out
So I let twitter decide between a few options that ended with ap.
And twitter agreed with my favourite option, so here’s rap.
rap gives a way to iterate on rows of a data frame, i.e. to
perform row-wise work. This is not the first attempt at the
problem.
The current state of the art was showcased in Jenny’s webinar, Thinking inside the box: you can do that inside a data frame?!, which I’m sampling here. I would advise however to check it out, and its associated github repo
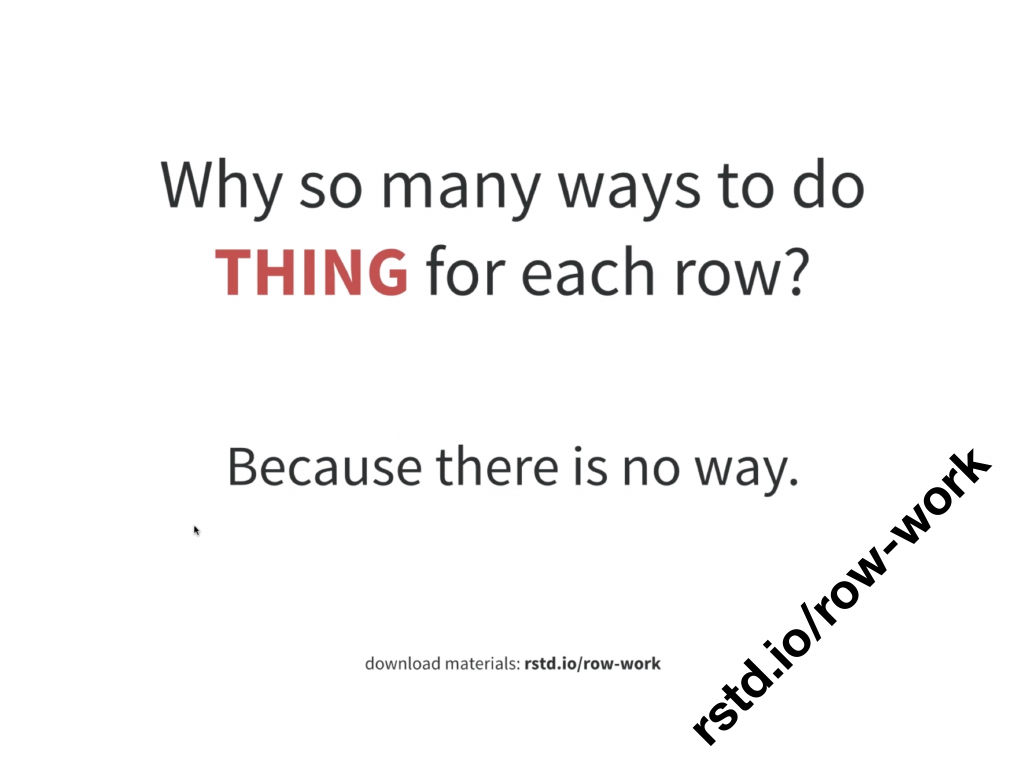
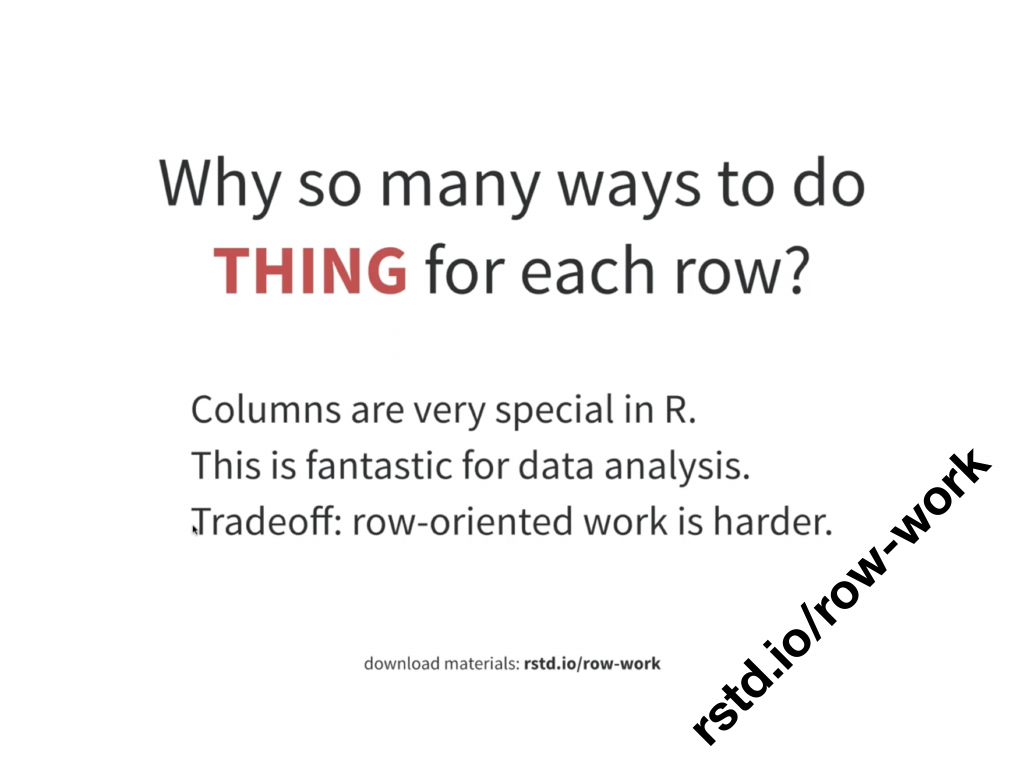
We have great tools now, in the tidyverse or elsewhere to work with columns, but working with rows is not that easy, and the reason why there are so many different ways to approach it, is essentially because we have not figured out “the way”.
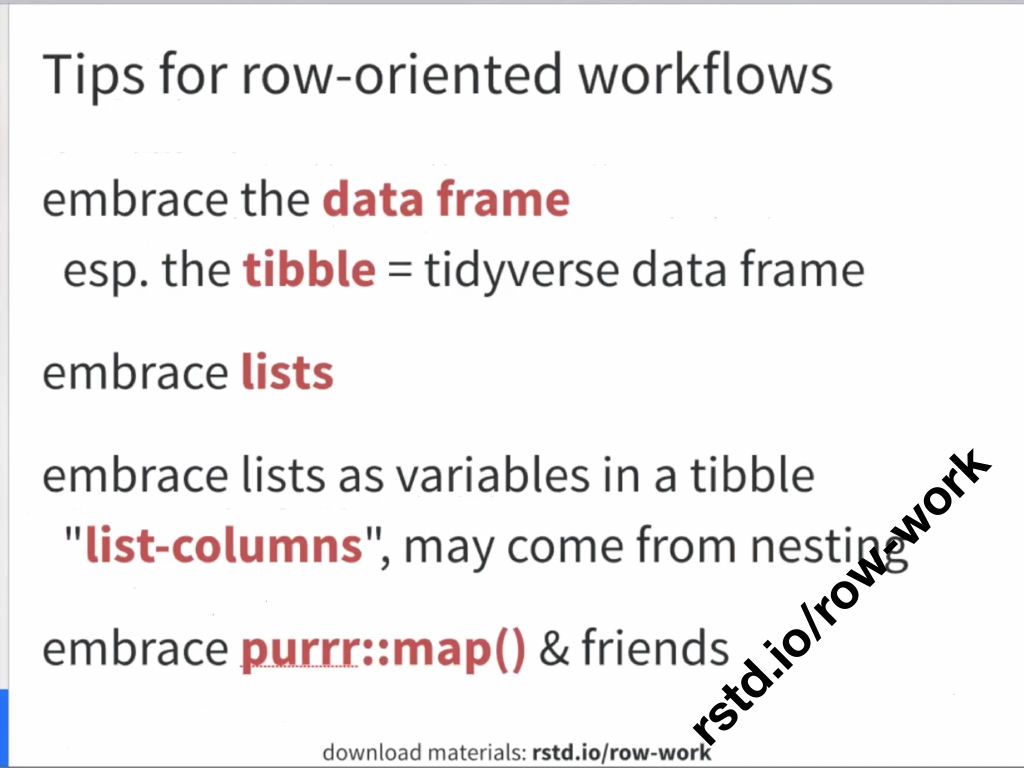
But working with rows becomes a very valuable tool when you realize that a column might be more interesting than just a vector of numbers or strings. We now have tools to routinely produce so-called list columns.
A list column is just a list, but it sits in a column of a data frame, which makes it easy to pair with other columns and to think jointly about a set of things.
So one of the take home messages from Jenny’s talk was to embrace the list
column philosophy and the map family of functions from purrr.
We’ll come back to that.
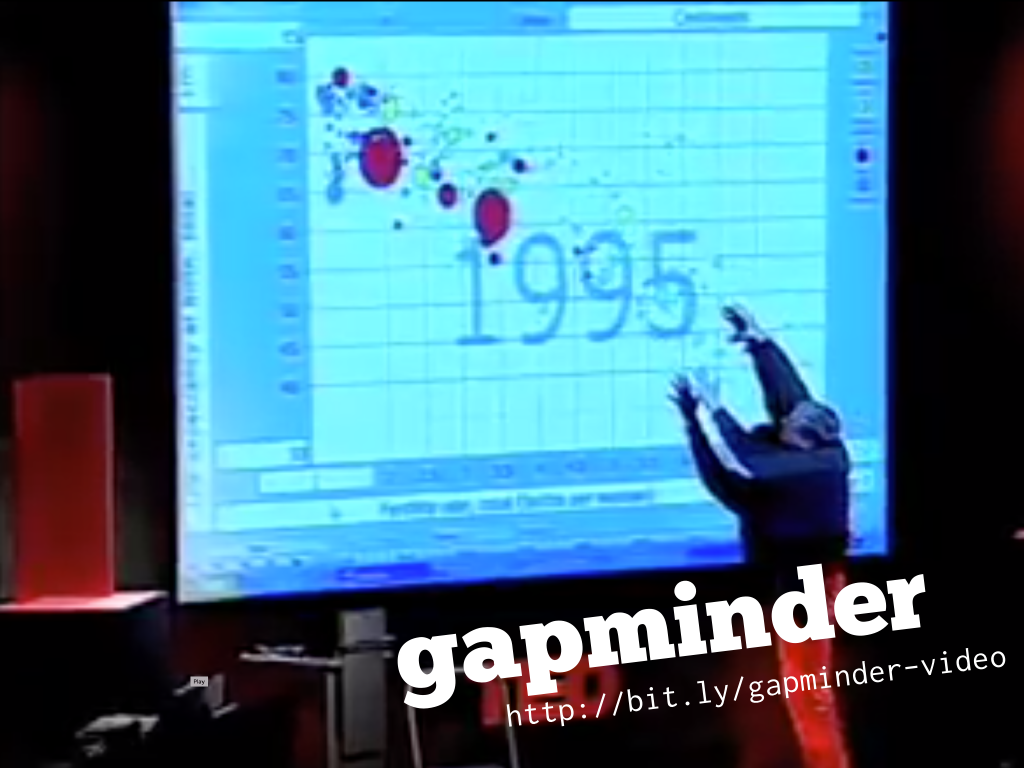
The other thing I’m sampling here is the gapminder data, available in the
… gapminder package. If you have not yet seen
Hans Rosling video, do it now, it
is an amazing presentation of socio-demographic data for all countries through time,
highlighting with data and graphics the development of countries. Serioulsy, watch it now.
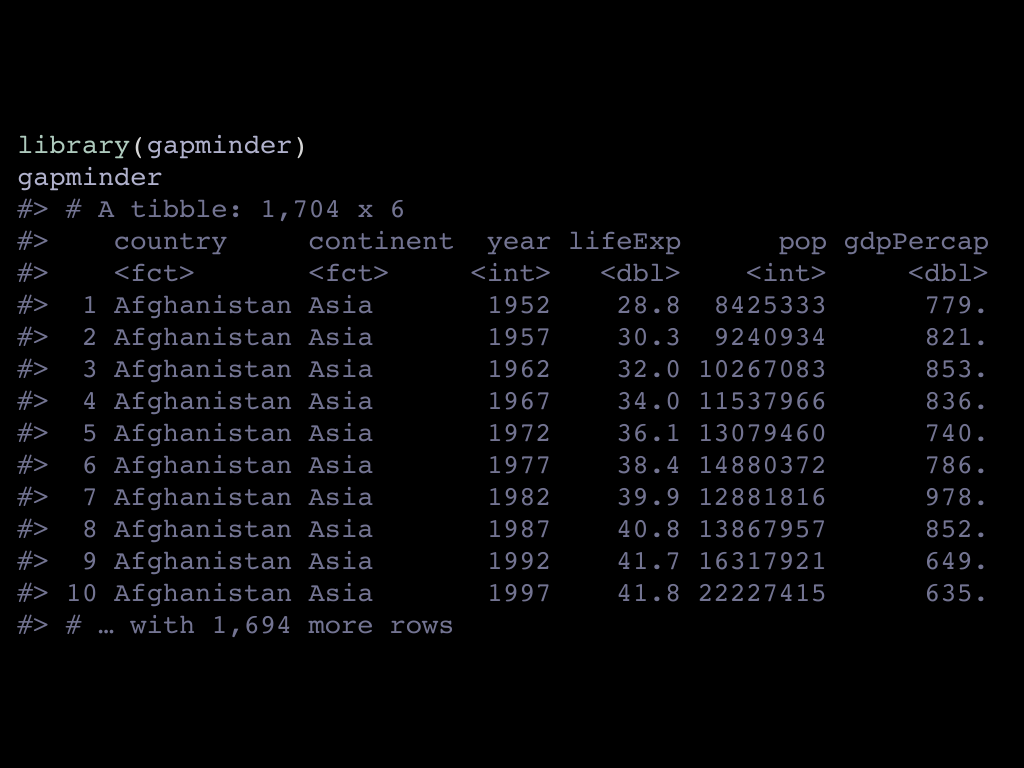
In the gapminder package, the data looks like this, it’s a simple enough tibble
with 6 columns. We have continent and country as factors, the year, life expectancy,
population and gdp per capita.
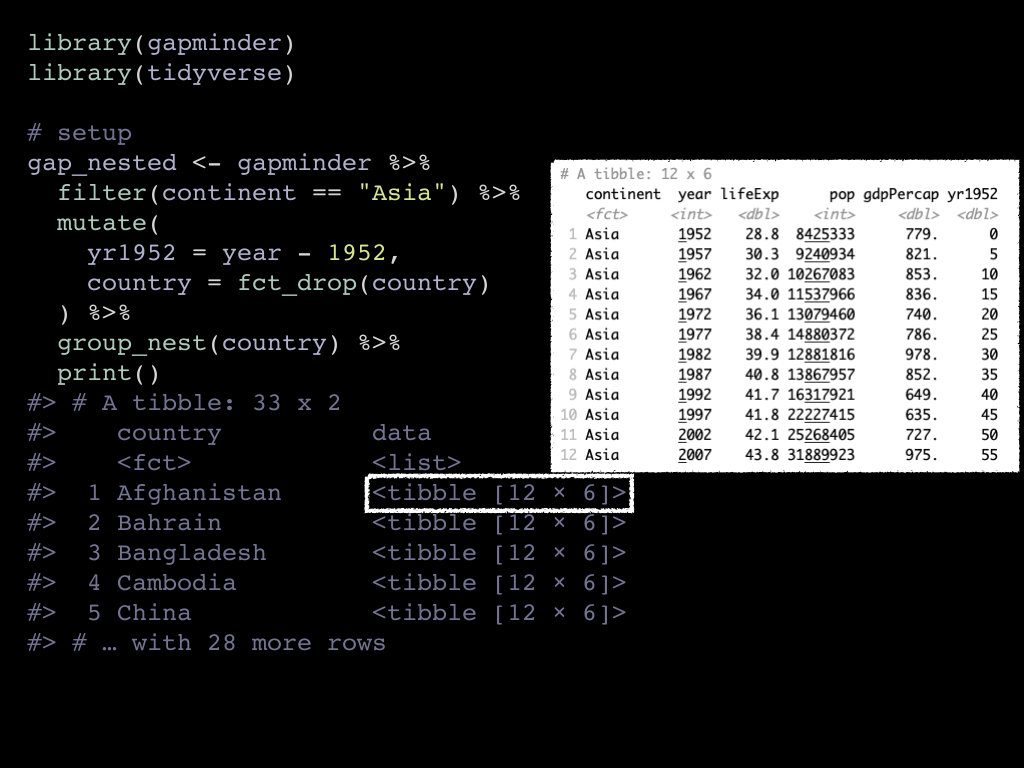
In the original shape, it would not really illustrate the point, so we restructure the data to have one row per asian country.
The resulting gap_nested data frame now has only two columns: country and
data, which is a list of data frames of all other variables, in other words
the other columns are nested. The yr1952 variable is created with a
mutate() for modeling purposes.
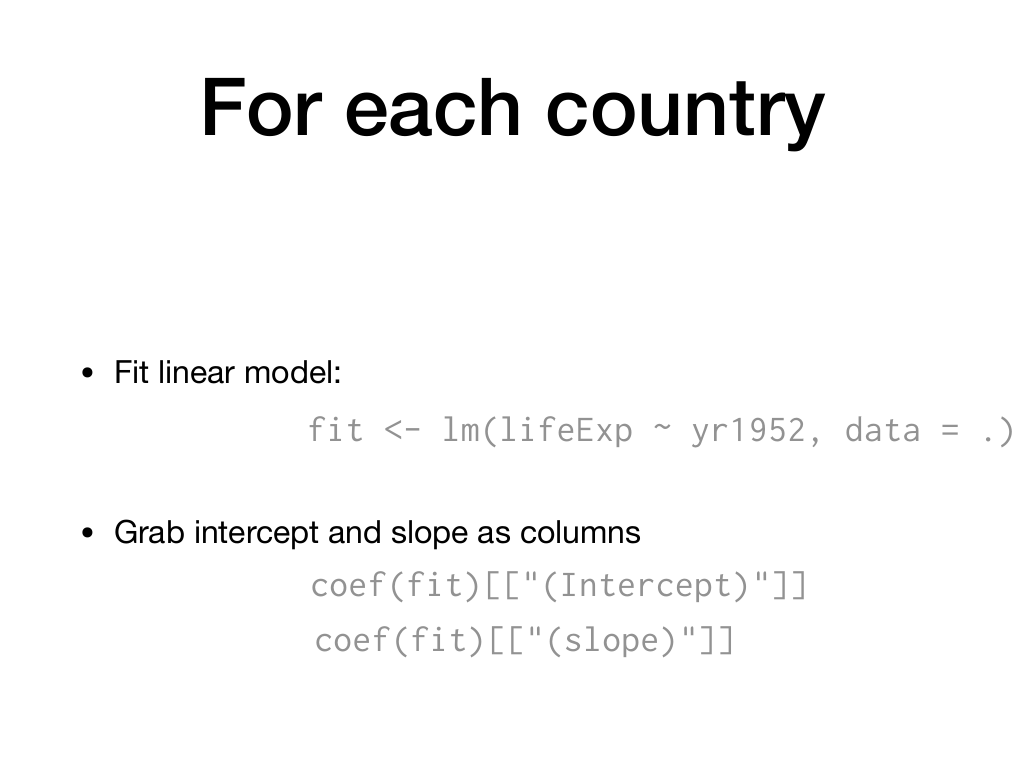
In this shape, we can do some row wised thinking. For each country, we want a linear model of life expectancy by the number of years since 1952 (the yr1952 column).
Then we want to extract intercept and slope coefficients for each of these models.
So we have one model per country, one intercept per country, one slope per country,
in other words model, intercept and slope have the same length and order as the number
of rows of our gap_nested tibble. A tibble is the perfect host for such information, we
would want to make a list column for the models and numeric columns for the coefficients.
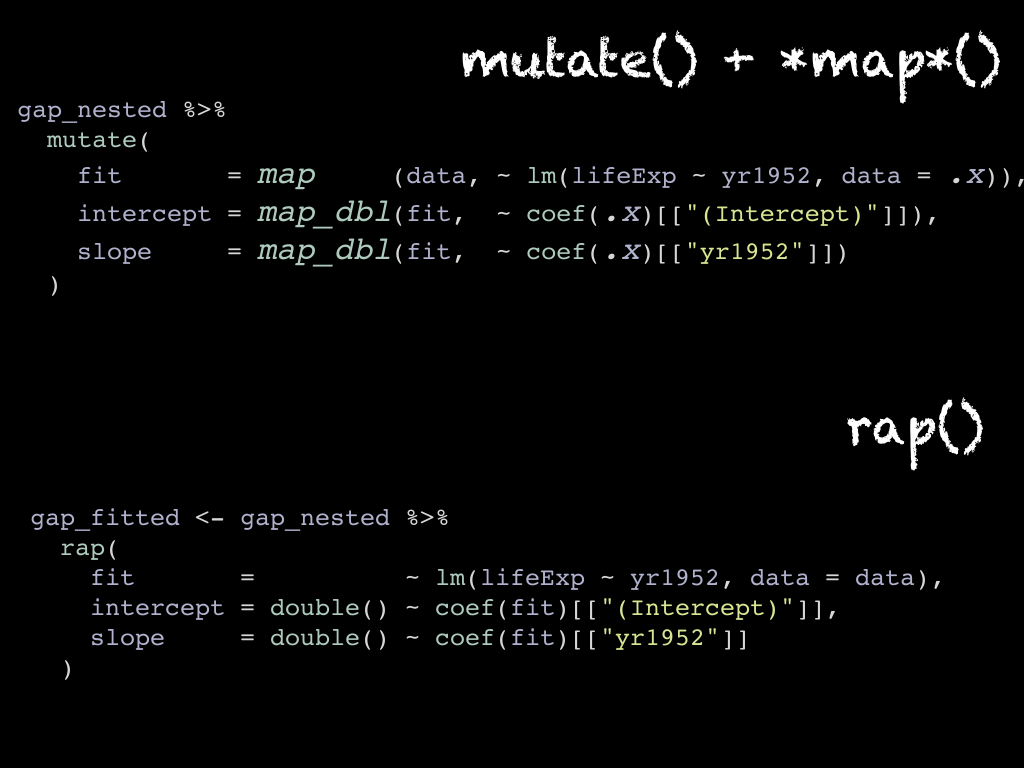
This is something that is typically done with the combination of dplyr::mutate() and
one sibling of the big purrr::map(). To use them we first have to identify a recipee
for one country, and then we let map() do the iteration work.
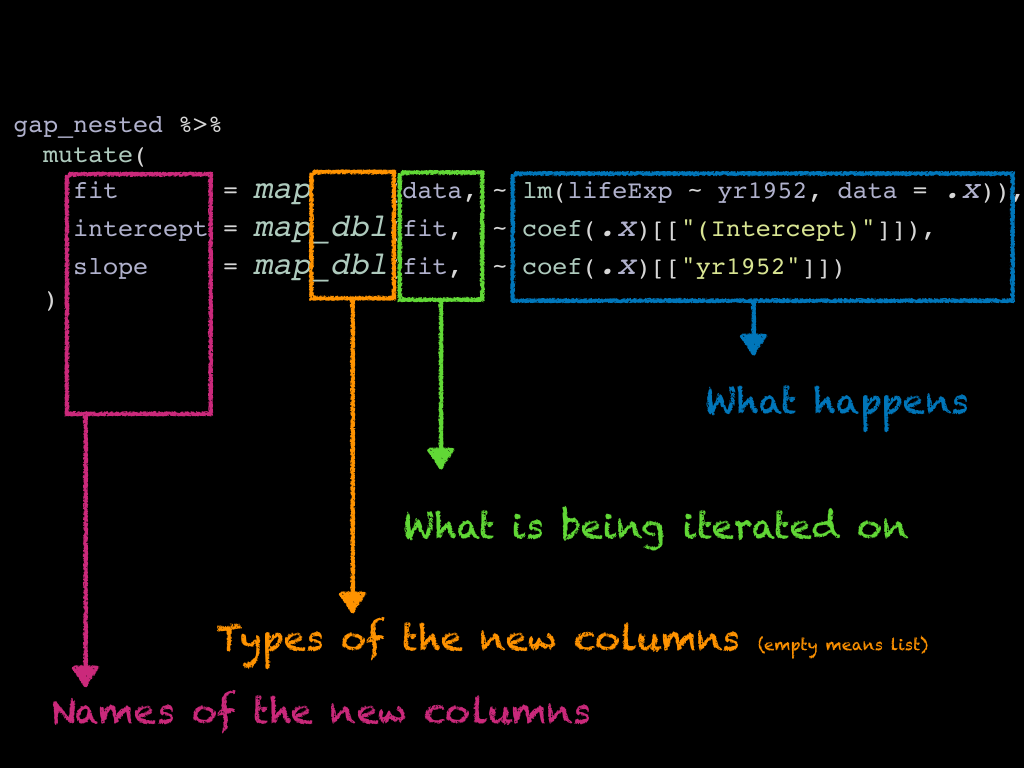
The map() family uses explicit mapping, you have to explcitely say which
columns you iterate one.
- The
map()calls iterate on thedatalist column, and applies the recipeelm(lifeExp ~ yr1952, data = .x)to each tibble from the list column. In the recipee,.xstands for the current column. - The subsequent
map_dbl()calls iterate on thefitcolumn we just created, so this time.xstands for one of the models.
The suffix guides the type that is created. Without a suffix, we get a list column. With the
_dbl suffix we get a double (aka numeric) column.
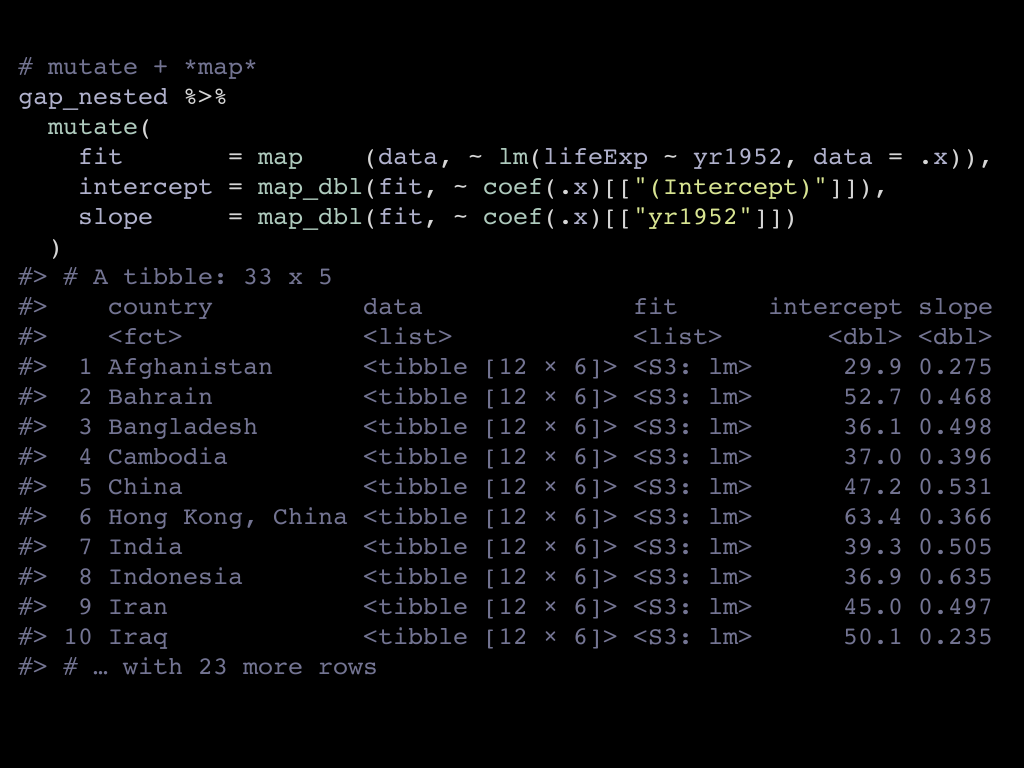
We get the results we want and expected. When Jenny gave her talk in the tidyverse team meeting and later as an rstudio webinar, I could not quite understand why, but I was not fully satisfied with this syntax.
I think I understand it better now, and I guess it is because I’m lazy and this is too much work to:
- have to call a version of
map()for each column - explicitely express what you iterate on
- remember it and internalize what
.x,.yetc … stand for in each line
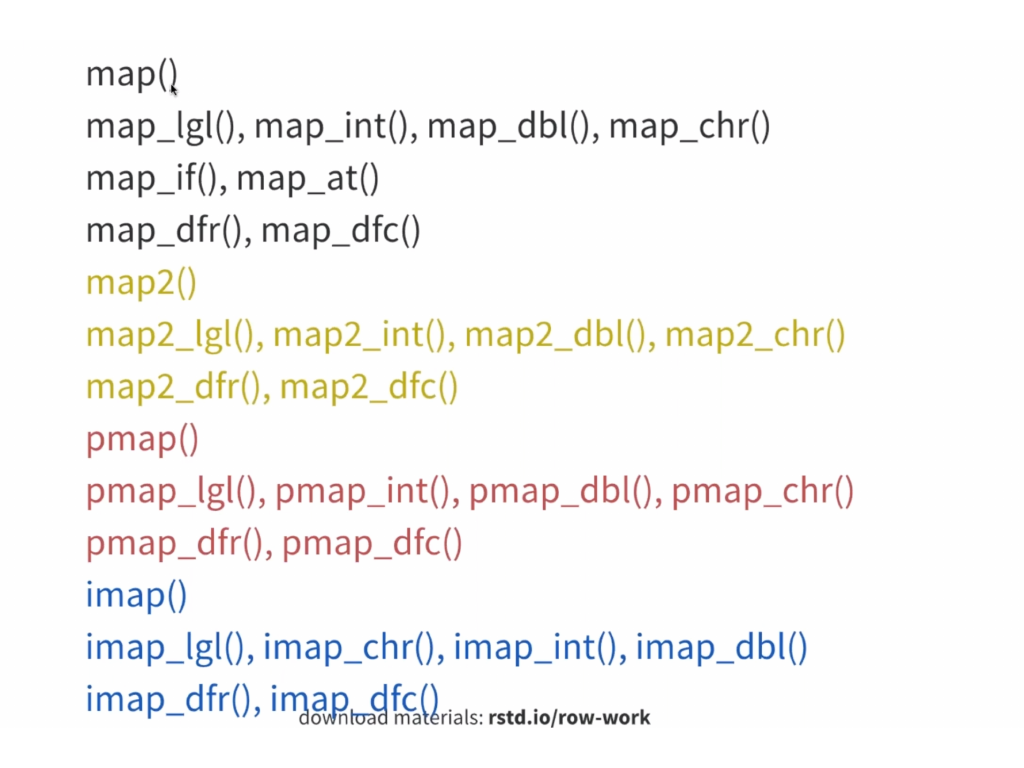
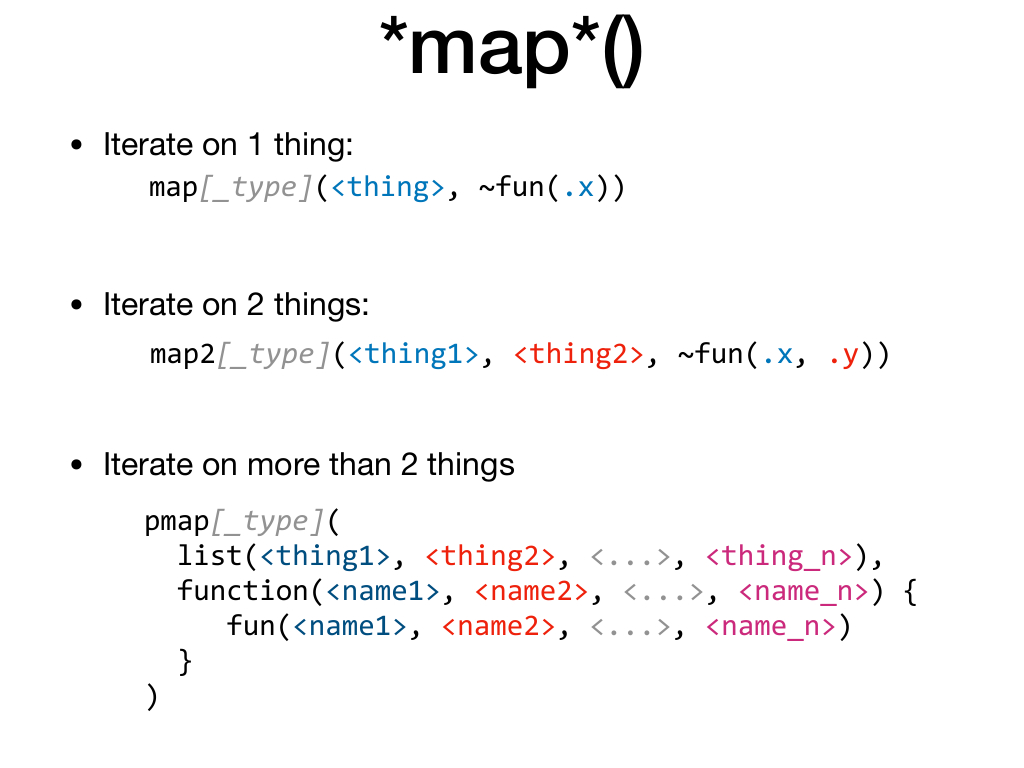
Furthermore, the syntax evolves depending on the number of things you iterate on.
If you iterate on one thing with map(), map_dbl(), map_chr(), …
you refer to the current value of the thing with .x.
If you iterate on two things with map2(), map2_int(), map2_lgl() etc …
you refer to the current value of the first thing with .x and the
current value of the second thing with .y.
But then, there’s no map3(), map4() etc … when you iterate on more than
two things, you have to switch to pmap(), put your things in a list and make a function
that carefully aligns its argument to the order of the things in the list, and then
eventually do something with the things.
What (in my perhaps very biased opinion) the map() family fails to capture
is that columns of a data frame are related. map() actually has no notion
that the things come from a data frame, it just operates on vectors.

The perspective is different in rap, and the mapping is implicit about the
columns. What you iterate on is the rows of the tibble.
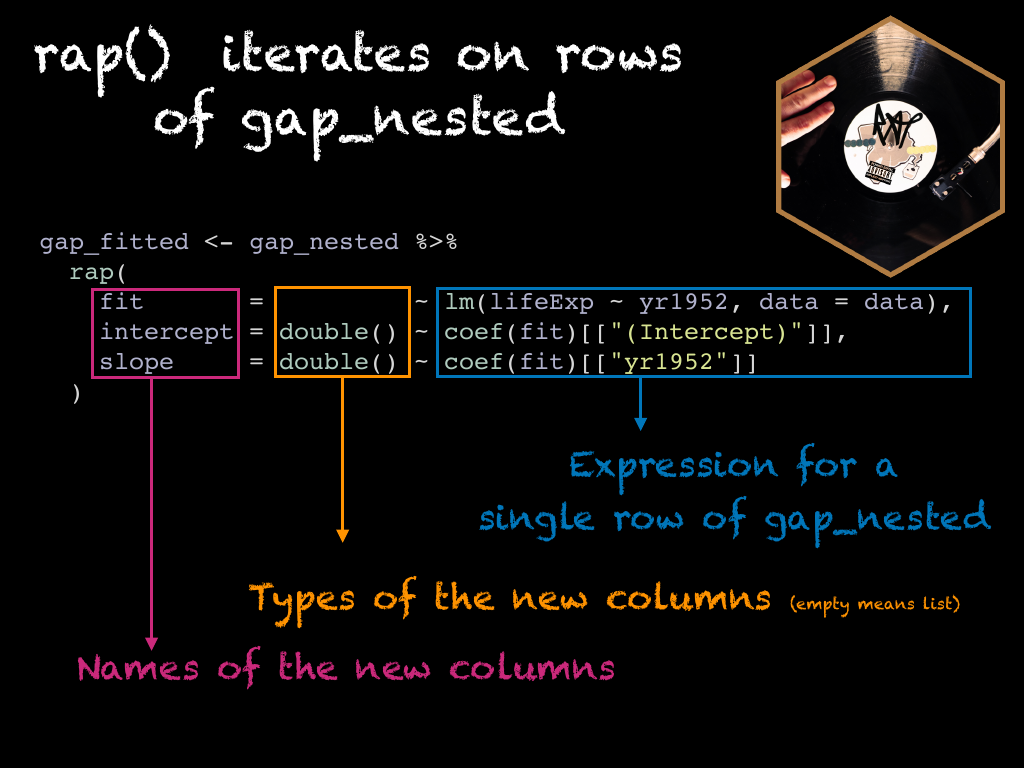
With the concept of implicit mapping, the previous example becomes this. We start from
the gap_nested data frame and we iterate on its rows implicitely.
As with the mutate() + map() example, we can identify 3 components : who = what ~ how
who: the name of the column we wish to createwhat: the type of column we create, on the left hand sied of the formula, when it’s empty it means you want a list column.how: the recipe.
It’s just one call to rap() to express the idea of iterating on rows of the
data frame simultaneously.
Instead of using a function suffix, the type is expressed, in the vctrs sense
in the left hand side of a formula.
Finally, the recipe directly uses the names of the columns, each name stands for
the current observation of the column. In the first line data is one of the
tibbles from the data column. In the following lines, fit stands for one of the
linear models.
That’s it really.

Before jumping to other examples, we need to briefly talk about splicing and
the splice operator !!!.
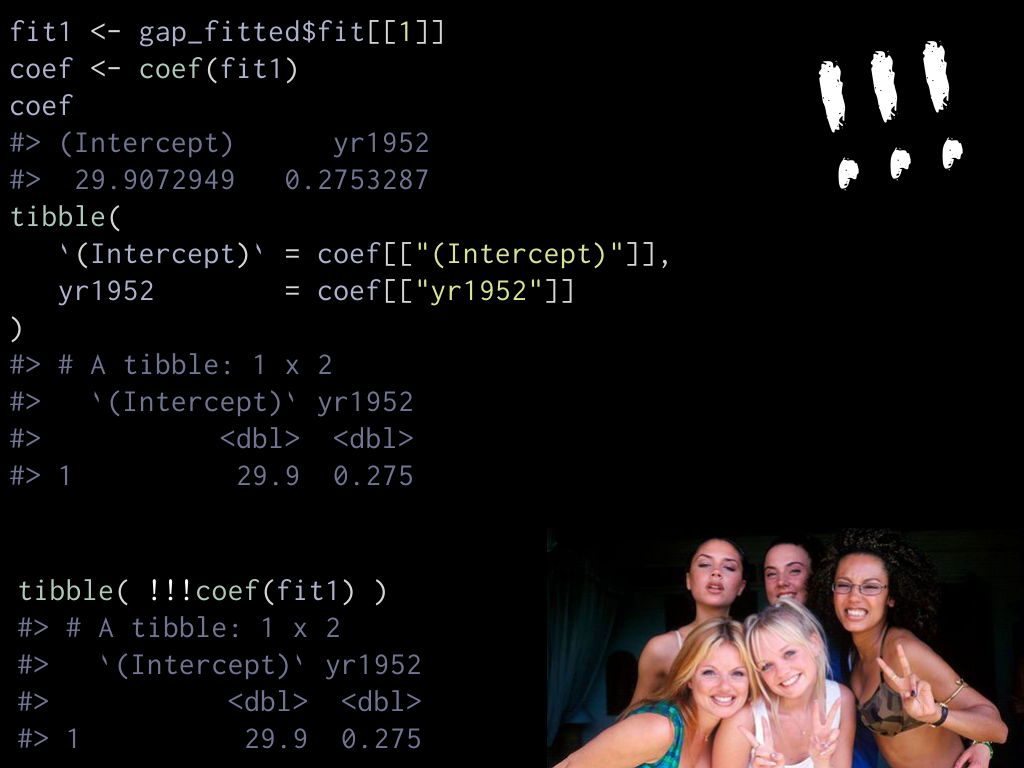
To do that, we need to step back and work with a single model, for e.g.
the first country. fit1 is this linear model, we can get its coefficients
by calling the coef() function on it, we get a named numeric vector.
If we want to convert to a tibble, we could laboriously extract each and
create a tibble. But instead of that we can directly do tibble(!!!coef(fit1))
to splice coef(fit1).
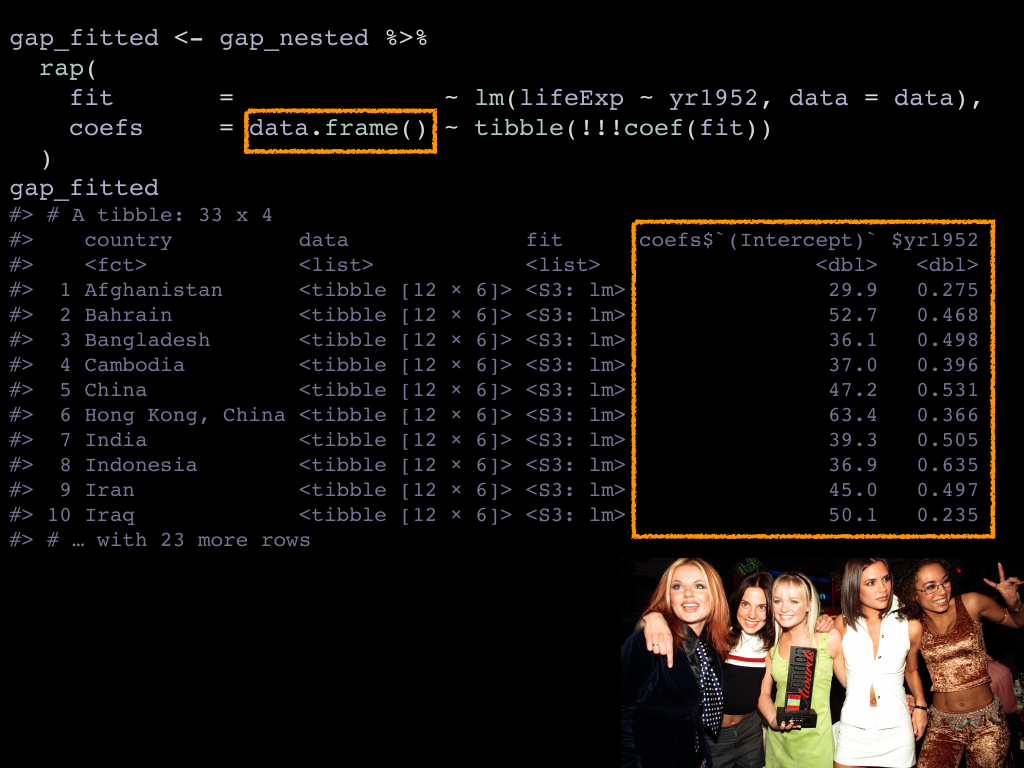
With that new !!! super power, we cna revise the previous example and instead
of making separate columns for intercept and slope we can create
a “data frame column” to host both. Data frame columns are a relatively
new concept, in that we currently lack proper tools to deal with them. They have been
there all along, but we don’t really have convenient ways to deal with them.
To do that with rap() you need to specify that you are making a data frame
column on the lhs, and then give the recipe to make of one those. rap() applies
the recipe to each row, checks that the data frame you created has exactly one
observation, and finally binds all the data frames together into a single
data frame column. 🎉
Splicing is not a feature of R, so you can’t splice anywhere, functions
have to be programmed in a certain way so that they undestand splicing. This is
the case for tibble() and many other functions from the tidyverse.
To come back to the title of this blog post, we knew since 1995 that spice rap … but
also rap() splice.
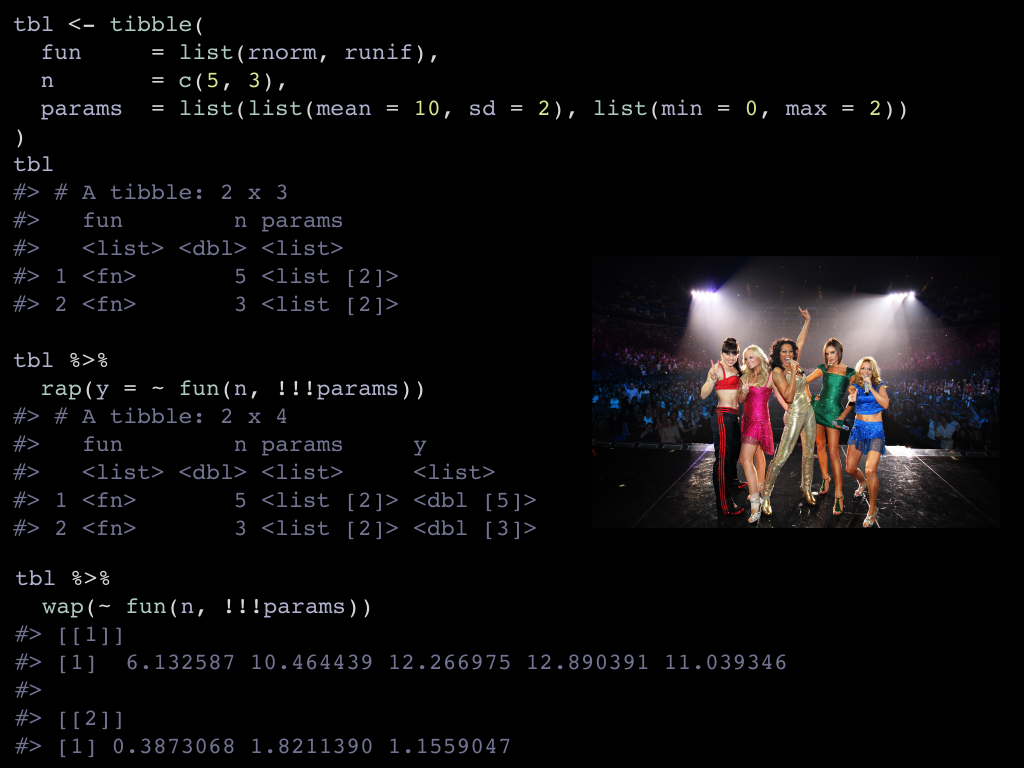
Last example, illustrating that rap() can splice, even rnorm() and runif() are
base functions, when we call them in a rap() line, splicing magically happens.
Here we have a tibble that expresses a simulation plan.
- The first column
funis the function that effectively simulates nis the number of observationsparamsis a list of function specific parameters to control the simulation.
So we’d like to call :
rnorm(5, mean = 10, sd = 2)on the first rowrunif(3, min = 0, max = 2)on the second
and store the results of both in a list column. This is what the fun(n, !!!params) says,
in particular:
funis one element of thefuncolumnnis one number from thencolumnparamsis one of the lists from the list columnparams.
Finally, there is also the wap() function to retrieve the result instead of
adding it as a column of the data frame. wap() is similar to pmap() but with
implicit mapping. I’ve chosen the name wap because it’s like map but with the m
upside down.

Once again, rap is an experiment, aka a weekend 📦. I believe the
notion of implicit mapping makes a lot of sense, that specifying the desired type
on the lhs of the formula is not too big of a jump.
It was cool to present it for the first time in an RLadies meetup, Faustine even took one of the hex stickers I brought with me.
So happy with my new #RLadies #dplyr and #rap stickers 😍🎉 thank you @RLadiesMontpel ! pic.twitter.com/9iPVoo7SjR
— Faustine Bousquet (@Faustine_Bsqt) December 13, 2018
I also sent some to people who supported me on patreon for whom I have the address. I’ll bring some to rstudio::conf, feel free to ask for some.
Very 😀 to receive this unexpected surprise from recent guest and friend of the podcast @romain_francois! The rap 📦is looking really slick and I'll be 👀its continued development. Just in time to put these on before #rstudioconf! pic.twitter.com/klhhS0fByR
— The R-Podcast (Eric) (@theRcast) December 16, 2018
This is my hand on the logo, and one of my favourite scratch record. Thanks again to Thomas for making it an hex logo. I think it’s pretty cool and would love to see it on your laptops.