I've been contributing to Rcpp for about a year now, initially to add missing bits that were needed for the development of RProtoBuf. This led to a complete redesign of the API, which now goes way beyond the initial code (that we now call classic Rcpp API). This has been quite a journey in terms of development with more than 1500 commits to the svn repository of the project on R-forge, and promotion with presentations at RMetrics 2010, useR 2010, LondonR and at Google, as well as many blog posts about Rcpp and the packages that derive from it.
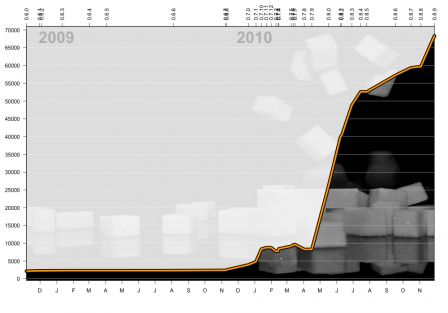
I wanted to take this opportunity to express visually how vibrant the development of Rcpp has been since it was first relaunched in 2008, and since I started to contribute.
The graph below shows the evolution of the number of lines (counting the .h, .cpp, .R, .Rd, .Rnw files) accross released versions of the Rcpp package on CRAN
The first thing I need for this is to download the 32 versions of Rcpp that have been released since 0.6.0.
Then, all it takes is some processing with R to extract the relevant information (number of lines in files of interest), and present the data in a graph. I'm also taking this opportunity to have some fun with raster images and the png package

The code explosion that started around version 0.7.8 marks the beginning of development of two of the most exciting and addictive projects I ever worked on: modules and sugar
The acceleration between 0.8.8 and the current version 0.8.9 represents many of the improvements that were made in modules. That alone, with more than 8000 new lines of code and documentation represents about 4 times as many lines as the total number of lines in 0.6.0
We still have plenty of ideas, and Rcpp will continue to evolve to deliver a quality interface between R and C++, to the best of the current team's abilities.
The full code is available below:

